

Oil & Gas | A Boom & Bust Industry In Transformation
Oil & Gas | A Boom & Bust Industry In Transformation
Reflexivity, Energy Transition, And Spillover Effects

In this post, I would like to cover George Soros’ reflexivity framework and explain how it it fits within the oil & gas industry. Why there is potential for upside excess and ways to think about asymmetric outcomes. To set the stage, an overview of the Reflexivity Framework from the Long Side:
A security starts trending upward and builds a gap to underlying fundamentals
The price of the security gets challenged by a temporary stagnation in fundamentals before the trend continues
After doubts have been refuted by Mr. Market, a substantial gap between price and reality builds (what one would call a bubble)
A deceleration in underlying fundamentals leads to peak optimism before things roll over (security price correction ahead of fundamentals) — underlying fundamentals cannot be good enough for prices to continue climbing.
Figure 1, Reflexivity Of A Stock Visual
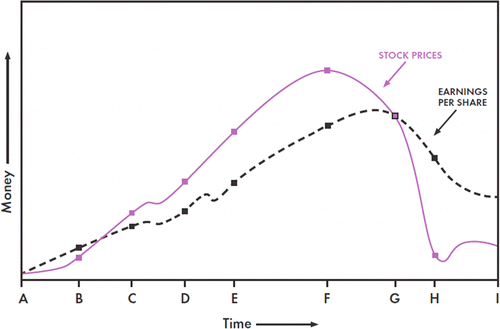
The idea behind this framework is that excesses allow market participants to participate in a bubble type of scenario even when prices have run a lot. In other words: Extremes keep becoming more extreme as the very existence of an excess lets acceptance towards an extreme prosper. This is a concept that applies universally all across the social sciences.
This writing is the 1st of a multi-part post series in which I will cover the broader industry dynamics in energies. In subsequent writings, I will become more specific and look at the energy transition at a company-level while further developing the upside/downside case. First, though, I believe that a fundamental understanding of the oil & gas industry will help to contemplate the factors that impact outcomes.
History | The Name Of The Game Is Spare Capacity
Ever since the energy industry came into existence, crude oil prices have been driven by boom & bust dynamics as a function of spare capacity. The EIA’s definition of it:
The volume of production that can be brought on within 30 days and sustained for at least 90 days.1
While 90 days defines the window of excess production very tightly, most of history has shown that the existence of an oil alliance controls the degree to which the oil spigots can be turned on and off.
It all began in 1858 when the discovery of crude oil in Pennsylvania led to the first wells in production a year later2. As crude became popular as a fuel source, demand quickly started to outstrip supply and there was the first boom cycle with production at 3 million barrels by 1862. The result: prices hit near $0 and producers went out of business.
Production quadrupled from a half million barrels in 1860 to over 2 million in 1861, and the price quickly dropped to $2/barrel by the end of 1860 and 10 cents a barrel by the end of 1861. Many new would-be oil barons abandoned the industry just as quickly as they entered.3
With the incorporation of Standard Oil in 1870 and its predominant market position across the value chain a decade later, John D. Rockefeller’s company became the first swing producer in oil 4. Starting off as an owner of refineries, SO and its affiliate companies weren’t only engaged in refining but ran the entire gambit from drilling to distribution (upstream, midstream, downstream). By 1904, the company controlled 91% of oil production and 85% of final sales in the U.S. 5. While Standard Oil’s pricing techniques weren’t said to be predatory, its economic strength most certainly allowed it to price against its competitors monopolistically 6.
The efficiencies of economies of scale and vertical integration caused the prices of refined petroleum to fall from over 30 cents a gallon in 1869 to 10 cents by 1874 and to 5.9 cents by 1897. During the same period, Rockefeller reduced his average costs from 3 cents to 0.29 cents per gallon.7
In 1911, however, regulators used the Sherman Antitrust Act against Standard Oil and split it geographically into 34 separate entities8. The first swing producer was dissolved and soon thereafter oil prices went haywire as they entered the next boom & bust cycle.
After the oil behemoth’s dissolution and the bust cycle that followed, it took until after WWII for the next strong oil alliance to form. The Railway Commission of Texas composed of the Seven Sisters: Exxon, Mobil, Chevron, Gulf, Texaco, BP, and Shell. Combined, the Seven Sisters didn’t only control 50% of the global oil market, but via their ownership of concessions all across oil producing nations had the ability to support the U.S. government with geostrategic missions9.
For nationalist leaders in Latin America and the Middle East, the dominance of the oil companies was a bitter pill to swallow. Oil formed the bedrock of state finances, contributing between 57 and 80 percent of foreign exchange balances, as well as 53% of the state budget in Iraq, 97% in Kuwait, and 71% in Saudi Arabia. Yet despite oil’s importance, the producing states had little say in how the oil was produced, marketed, or sold. They felt as though they were at the mercy of the multinationals, which realized immense profits while returning only a small portion of the earnings to local governments.10
As the western world’s dependence on middle eastern oil grew, so did the uprising against multinationals exploiting fossil fuels. In an effort to force the Seven Sisters to give up their concessions, OPEC engineered a price-hike policy with which middle eastern countries would threaten nationalization in case of non-compliance.
The unilateral increase in the price of oil engineered by OPEC in 1973-74 facilitated, in the words of one scholar, “the largest nonviolent transfer of wealth in human history.”11
As the Seven Sisters’ time as the incremental producer of oil came to an end, national oil companies (NCOs) took over and OPEC had begun controlling the fossil fuel market (more on OPEC later.)
Figure 2, Presence of an Effective Swing Producer | Standard Oil, Seven Sisters, OPEC

As the Rapidan graph shows, during times where a swing producer could balance markets - particularly in the early innings under Rockefeller as well as the RRC where the U.S. government had a firm grip on producer output, - oil prices were relatively stable. In the absence of a swing producer, higher prices would attract a flood of new supply and thus lead to another cycle of volatility.
The degree to which spare capacity affects price becomes even more clear when we connect swing producers with oil disruptions.
Figure 3, Disruptions and Spare Capacity

With this bit of history, we will keep bearing spare capacity and its implications in mind: in absence of a swing producer that is able and willing to turn the spigot on and off when needed, crude oil prices can be extremely volatile. While most people tend to think about events such as -$40/bbl on April 20, 2020 as well as current prices at $130/bbl, the same dynamic has played out over many cycles and decades before.
Oil & Gas Returns | A Ghosted Sector (2009-2021)
Going back to 2009, the energy sector was weighted at 14.10% in the S&P 500. Most of the legacy oil businesses were considered to be blue-chip investments without disruption risk. Fast forward to September 2021, the sector’s weight decreased to 2.75% and Exxon had been ejected from the Dow Jones Industrial Average a year earlier (after becoming largest U.S. company in 2013.)
In the same vein, supported by record low rates and increased risk appetite, technology went in the diametrically opposite direction. From a similar weight in the S&P 500 back in 09, the S&P’s technology component had reached close to a 30% weighting in the index. Rather than a direct return comparison, this illustrates the extent and velocity with which change can happen.
Figure 4, CAGR and Total Return comparisons [2009 - Sep. 2021]
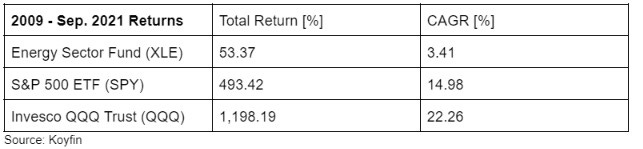
In order to look ahead in an industry that has been destroying value for as long as it has - before oil prices recovered, - let’s look back on what has transpired over the course of a decade and what it may mean in the years ahead.
Oil & Gas | CAPEX, Bankruptcies, Economic Value Destruction
After increasing net imports almost each year since 1954, the U.S.’s dependence on foreign oil slowly but surely started to decrease on the back of $145/bbl oil in 2007. The reason: shale drilling. A horizontal drilling method that utilizes hydraulic fracturing to extract oil and gas from sedimentary rocks12.
Figure 5, U.S. Petroleum Figures

What had started as a less viable option for drilling developed into the marginal cost production method of the 21st century. Cost efficiency gains in U.S. production as a result of better drilling technology reversed a decades-long trend and threatened the hegemony of OPEC as well as Russia in the fossil fuel market.
Figure 6, Average U.S. Shale Drilling Cost

Cost progress in the shale complex brought America’s oil production from ~5.7m bbl/day in 2021 to 8.8m bbl/day by 2015 — marking the first substantial push in the modern era towards America’s energy independence. In the process, U.S. oil imports kept falling and the race for volume was on. Instead of stabilizing prices after they had gone from $110 to $75, OPEC leaned into it. On November 27, 2014, Saudi Arabia stressed the importance of maintaining the group’s production target13.
Understanding a specific commodity market has to include an understanding of the businesses and countries that interact in it. In most commodities there is a concentration of who dictates supply and that is certainly the case in crude oil. When U.S. shale benefitted from increased cost-efficiencies, they essentially took on two of the world’s largest producers in a run for market share: Saudi Arabia and Russia. Essentially, both economies run on fossil fuels.
Saudi Arabia: Using 2021 numbers, 60% of Saudi Arabi’s fiscal revenue is directly tied to the country’s oil component (SAR558bn ~ $148.72bn)14.
Russia: The Warsaw Institute estimates (2018) that 38.9% of Russia’s total production activity is tied to oil & gas.
The reliance on oil extends across the middle east and makes most of their social programs, therefore social satisfaction, depend on one major source of income.
Figure 7, Russia and Saudi Arabia Hydrocarbon Dependence

As the U.S. entered the market, the predominant position of Saudi Arabia and OPEC had declined and that was not what gigantic social programs in the middle east wanted to see.
Figure 8, OPEC Market Share | The Threat Of Shale Oil
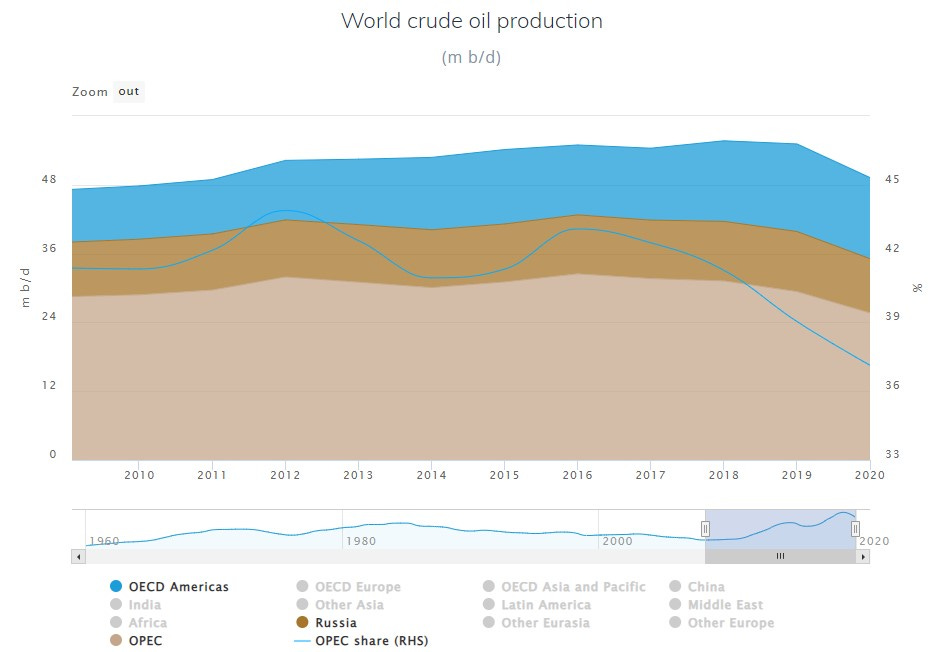
You do not wage a “war” against the lowest cost producer and expect to win, at least over the short term.
Using low-priced OPEC oil to break U.S. shale, oil prices headed south and signs of debt-stress became readily apparent starting in 2014.
Figure 9, Oil Price Decline 2014-2016 | A War For Crude Oil Volume
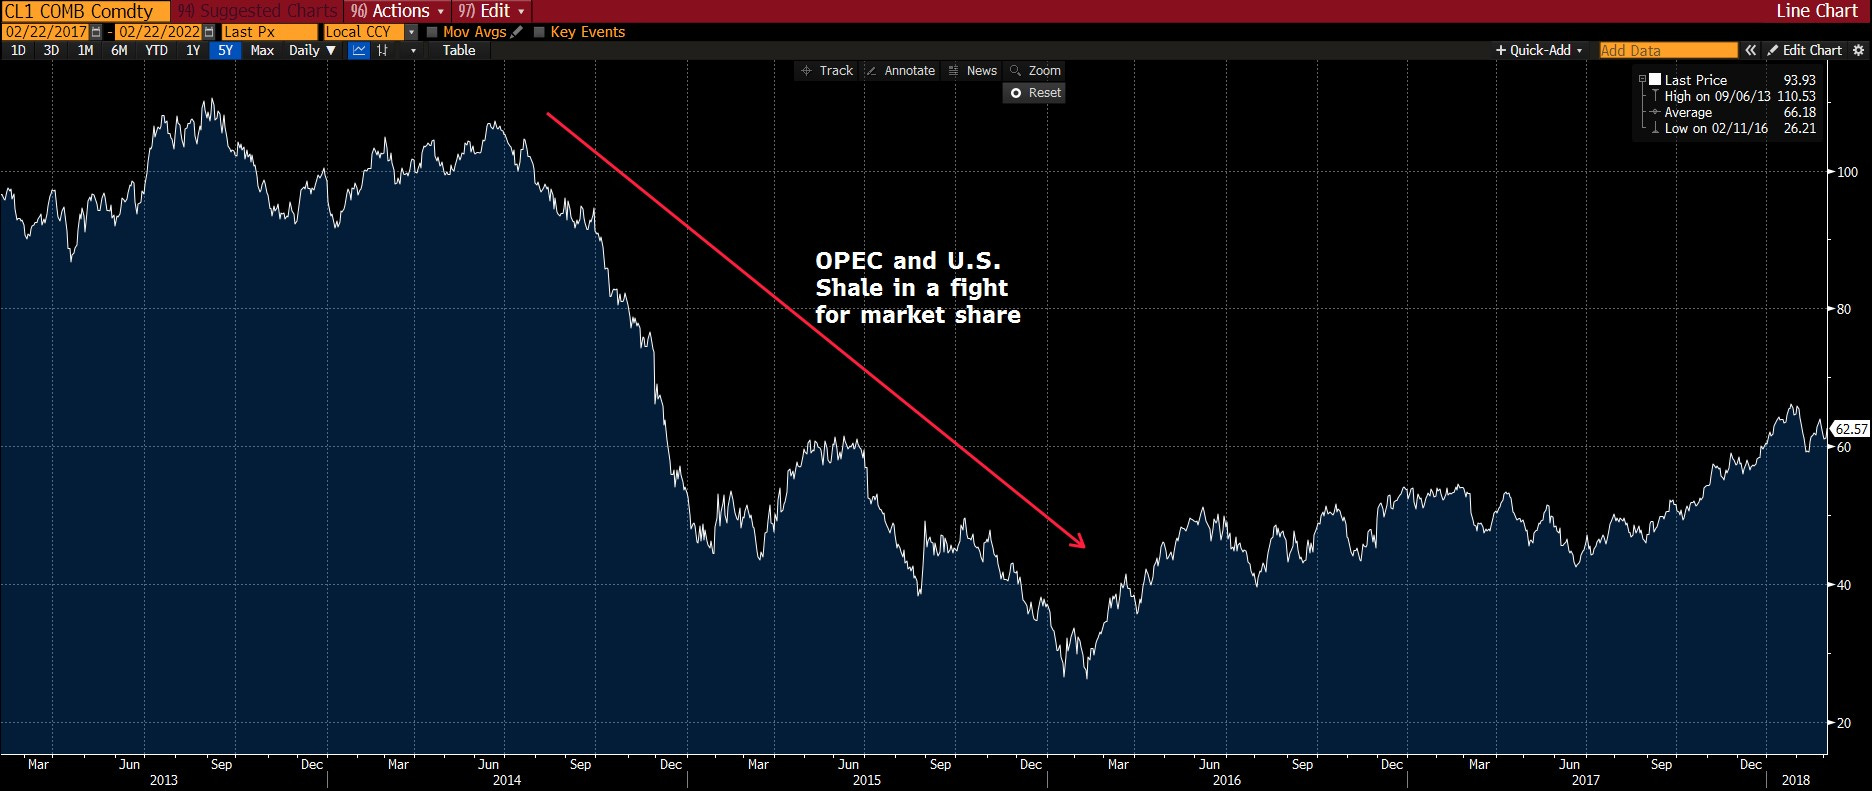
Figure 10, Bloomberg High Yield Independent Energy Index

As credit spreads expanded, so did bankruptcies — followed by drop off in oil & gas CAPEX from $430.9bn in 2014 to $227.5bn by 2016.
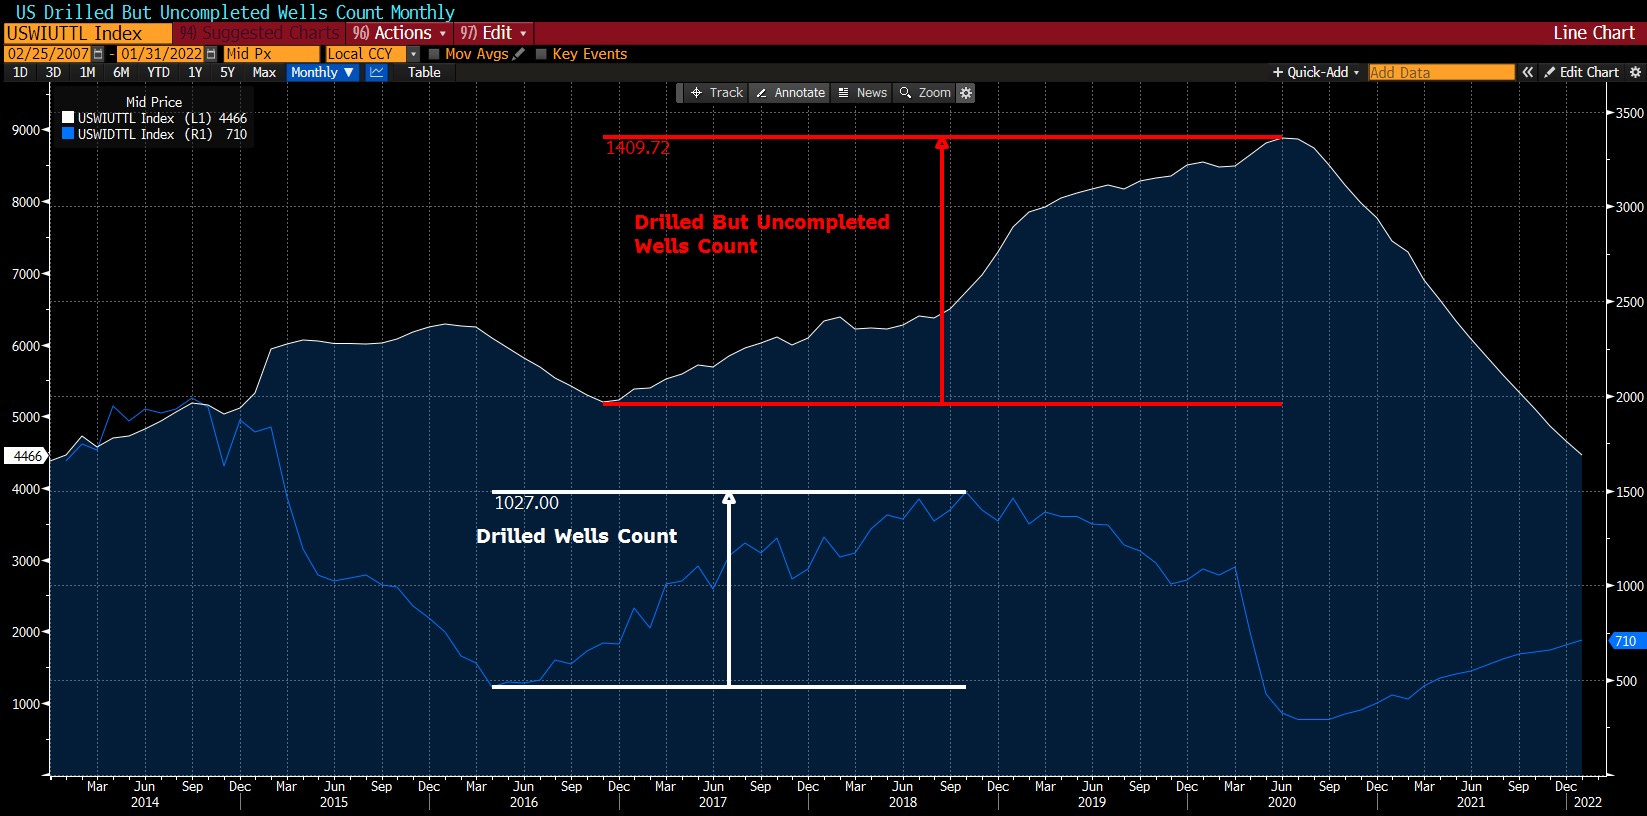
Energy markets run in cycles, however, and capital spent today will impact supplies in the outyears (just think about development & exploration activities for future production.) In fact, despite CAPEX being cut in half, Net Developed Acreage for North American Crude Oil Production quadrupled from 2016-2017; drilled but uncompleted wells also increased from 5,500 to ~8,900 from 2016-2020.
Figure 11, DCUs and Drilled Wells Count
The ripple effects from a massive spending cycle quickly translated into a long stretch of poor returns for E&P securities. A combination of levered balance sheets, emerging ESG talk, and OPEC as a production overhang all made the industry unattractive for investors (justifiably so).
Figure 12, Levered Balance Sheets | Net Debt/EBITDA (Crude Production HY Credit)

Figure 13, Crude Oil Prices - Energy Stocks | Tesla
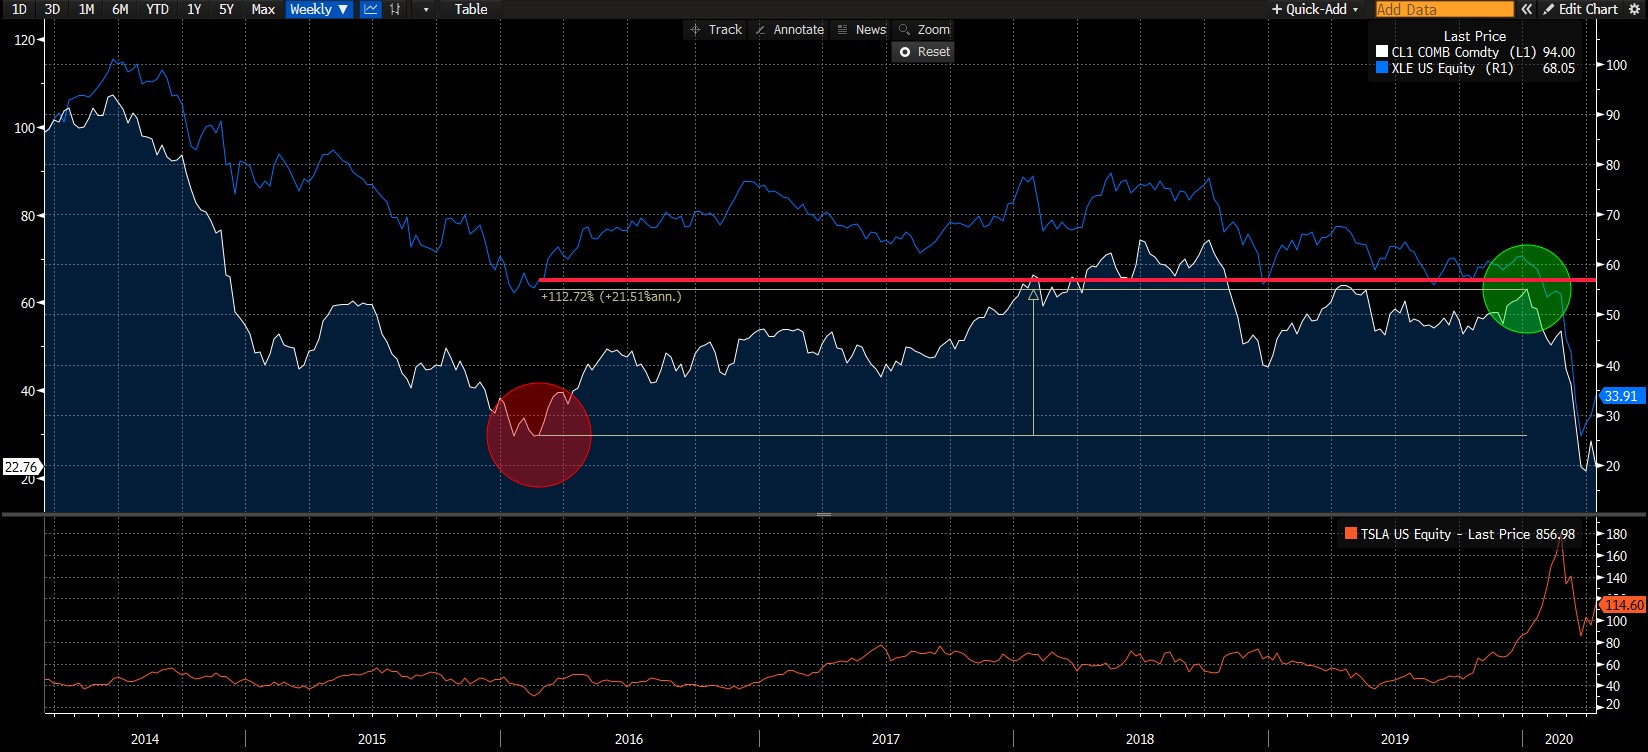
While Crude Oil had rallied 112.72% from the bottom in early 2016-2020, the Energy ETF (XLE) was flat over the same time frame.
Figure 14, Economic Value Added, ROIC, CapEx (XOM, CVX, COP, OXY)

Whenever stocks don’t follow the performance indicators they’re supposed to be driven by (figure 13), there is usually something beneath the surface that may be holding things back.
Understanding the Bear Case | Renewables, Debt-load, Capital Destruction, Stranded Assets
Prices aren’t necessarily as much a reflection of the underlying fundamentals of a business, but rather a representation of what type of change investors do or do not expect over the years and decades to come. Very stable businesses with a wide competitive moat but low growth rates don’t experience a lot of volatility - i.e. defense stocks - as the perception of risk does not change materially over time. For the better part of modern history, something similar could be said about energy stocks: global population growth and rapid urbanization in developing countries would all be powered by hydrocarbons. The conversation shifted drastically, however, and a tail risk turned into a perceived inevitability — hydrocarbons replaced by renewables, assets stranded, and decimated equity value as E&Ps were loaded with debt.
A track record of insufficient capital discipline only compounded the view of investors that this is indeed an industry on the brink.
BHP’s $50 billion shale oil blunder - ABC News Australia, Aug. 2017
The Humbling of Exxon - Bloomberg, Apr. 2020
Ultimately, Covid was the last stroke that broke the camel’s back. Besides airlines & travel, oil as a transportation fuel was at the very forefront of getting hit by global demand destruction. With more than 100 oil & gas bankruptcies just in 2020, even the last investor’s pockets were emptied (figure 10). As one would expect, capital does not tend to return to industries that have an unlucrative business model combined with a product that may be much less relevant in the future.
Figure 15, Oil Demand Forecasts to 2050

If you were to act based on the many demand forecasts we’ve seen for hydrocarbons, it would unequivocally be a massive short opportunity — after all, the forecasts imply that the industry is disappearing and most companies’ assets are most likely losing massive lifetime value.
Summarizing the bear case on oil & gas from 2009-2021:
3 bear cycles (2 macro; 1 sector specific) resulted in value destruction for investors across the hydrocarbon value chain ($300bn in shale alone)15
Global policy goals towards net-zero will result in existential threats for E&P
Undisciplined capital will destroy value no matter the price of hydrocarbons
The Bull Case | Financial Discipline Intertwined with Transition Support by Hydrocarbons to Green
Managing Stranded Costs on the Long Road to Net Zero - Bain & Company
In May 2021, the International Energy Agency, the world’s energy modeler of record, stated that “no new oil and natural gas fields are needed” if the world is to stay on a path that limits warming to 1.5°C. However, just seven months later, a report from IHS Markit and the International Energy Forum indicated that continued underinvestment in oil and gas development could contribute to volatility, price shocks, and scarcity.
The world has adopted an absolutist thought-framework in which there are only two states of existence (with nothing in between):
All in on hydrocarbons
Shut hydrocarbons down instantly and switch to wind & solar
Short-Run Effects of Underinvestment
I would like to differentiate between the short-run effects from underinvestment and the long-run implications for how this transition may look over the course of the coming decades. The short-run is a function of supply/demand imbalances, CAPEX, oil embargos, etc. That’s where the aforementioned reflexivity framework will come in as well.
In short: the same lag that has resulted in an oil glut on the back of +$400bn in CAPEX may lead to a substantial imbalance on the front-end of the curve and result in unpredictable price swings (to an extent, we have already seen that play out.)
Figure 16, Oil & Gas CAPEX, 2010-2022
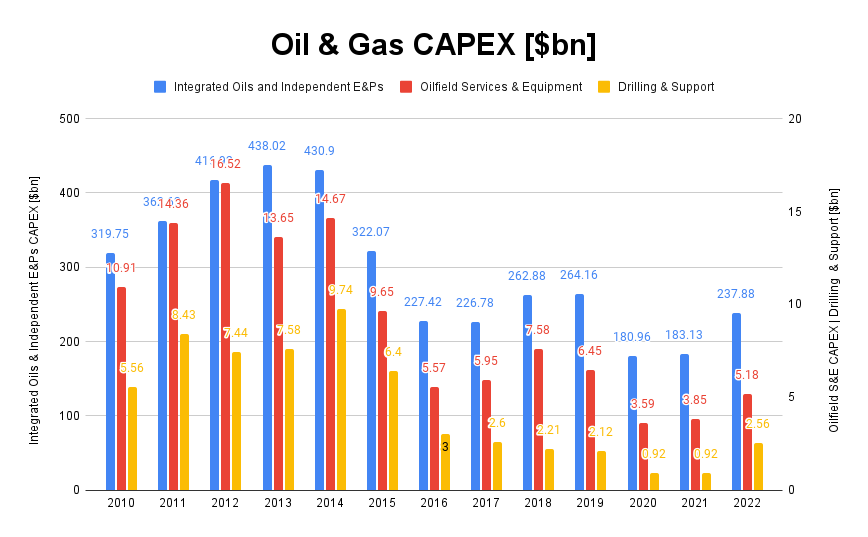
We observe that optimistic demand forecasts - from the renewables perspective, - in conjunction with low CAPEX across the oil & gas value chain may result in an unexpected asymmetric outcome. By definition, a tail event surprise is defined as such because consensus does not expect it.
At the very latest, war in Ukraine and sanctions against Russia have shown how much we rely on hydrocarbons. Even before the Russia’s invasion, European gas supplies were extremely tight and each pullback in prices was only reinforcing the next leg higher. If it wasn’t for a mild Asian winter, Europe would likely have faced an even worse outcome in regards to sky-high nat. gas prices.
Figure 17, Netherlands, Germany, UK Natural Gas Front Month Prices | Reflexivity
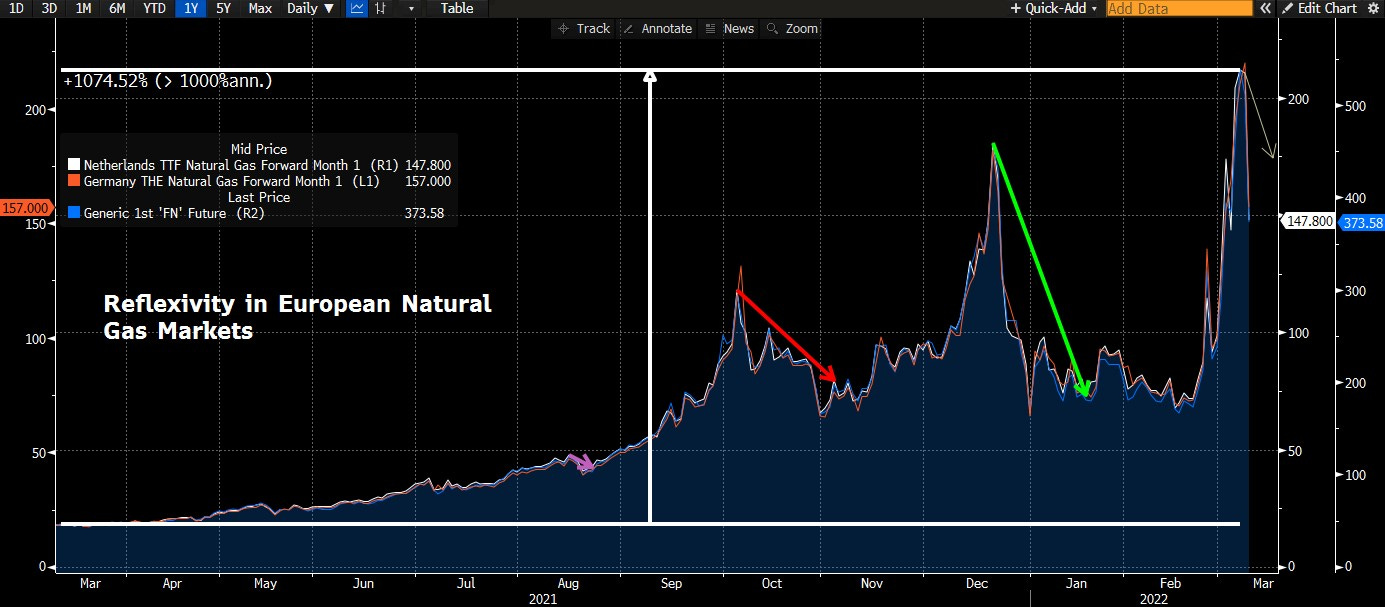
This is a prime example of a reflexive move that has already occurred in a contained geographic area: the idea that renewables would save the day when fossils aren’t delivered was rejected by market forces; the economy is just too reliant on traditional sources of fuel. Eventually, the cure for high prices will be high prices and while prices may stay sticky, underlying fundamentals can start to improve. Unlike software, though, hydrocarbons are not re-programmed that easily. It takes 3-5 years to build a natural gas terminal and about 18 months to use a new gas liquification facility on a ship.
While there is no clear way of predicting the next price move in the global WTI Crude Oil front-month contract as well as Henry Hub Natural Gas, one thing sticks out: vicious moves beget more vicious moves. Liquidity dries up on both sides of the extreme; when oil prices went to -$40, there was no way to tell where it would stop. The same dynamic is plausible - without determining any probabilities here, - in a front month contract that is already standing on shaky footing.
When we think about reflexivity, let’s look back on April of 2020 and what had transpired.
Reflexivity Event | Excessive Downside (Crude at -$40/bbl)
On April 15, 2020, the CME Group - the primary futures exchange for WTI Crude Oil, - notified clients that “recent market events have raised the possibility that certain NYMEX energy futures contracts could trade negative or zero trade pieces or be settled at negative or zero values,...”. The Oil Volatility Index (OVX) was trading near 120 at that point and oil prices had fallen from roughly $65 before the onset of Covid to about $20 that day.
For reference: For 5 years before then, the OVX had been trading between ~18-80.
Still looking for ways to catch a falling knife, the long thesis got vehemently rejected after brokerage houses started restricting the purchase of front-month oil contracts. Liquidity dried up rapidly and what nobody could believe indeed happened. The floor at $0 did not exist and physical product suppliers had to start paying anyone with the storage capacity to pick up the oil at delivery. The line of progression within the reflexivity framework:
Oil prices declined from $65 in tandem with stock prices reaching a low at the end of March
The hypothesis that crude oil would follow risk assets back up got rejected and prices kept declining into April 15th
Almost seen as another upward rejection was the $0 mark on April 20, 2020. Unlike expected by many, prices did not stop going down and went straight to -$40/bbl.
Unlike prices, however, underlying fundamentals had started to improve or at least gotten worse less fast. What was not obvious to everyone started to be a probabilistic bet on the upside for those bold enough to take the bet.

Again, whether we will see a similar event on the upside is not certain, but the ingredients are there. In fact, one could argue that we have already entered a reflexive move.
The Long-Run Transition
Discounting a new energy source that can suddenly replace all existing power supplies, a transition to a new form of energy happens over the course of decades. In fact, if we look back on the phasing out of coal, we observe that the world has barely had any success in getting rid of the dirtiest of all energy sources. The Atlantic in its article Why the Energy Transition Will Be So Complicated:
The coming energy transition is meant to be totally different. Rather than an energy addition, it is supposed to be an almost complete switch from the energy basis of today’s $86 trillion world economy, which gets 80 percent of its energy from hydrocarbons. In its place is intended to be a net-carbon-free energy system, albeit one with carbon capture, for what could be a $185 trillion economy in 2050. To do that in less than 30 years—and accomplish much of the change in the next nine—is a very tall order.16
Figure 18, World Total Energy Supply By Source, 1971-2019

When we think about the implications that a global energy transition may have on the types of fuels that we will have to burn, it is crucial to understand how the energy mix varies by region/continent. While the developed world may have the luxury to afford less dense sources of energy - this transition is also unique in the way that we are shifting from high to low energy density, - the developing world is far from implementing sustainable solutions; ultimately, with the threat of hindering long-run economic growth targets.
Figure 19, World Total Energy Supply By Region, 1971-2019
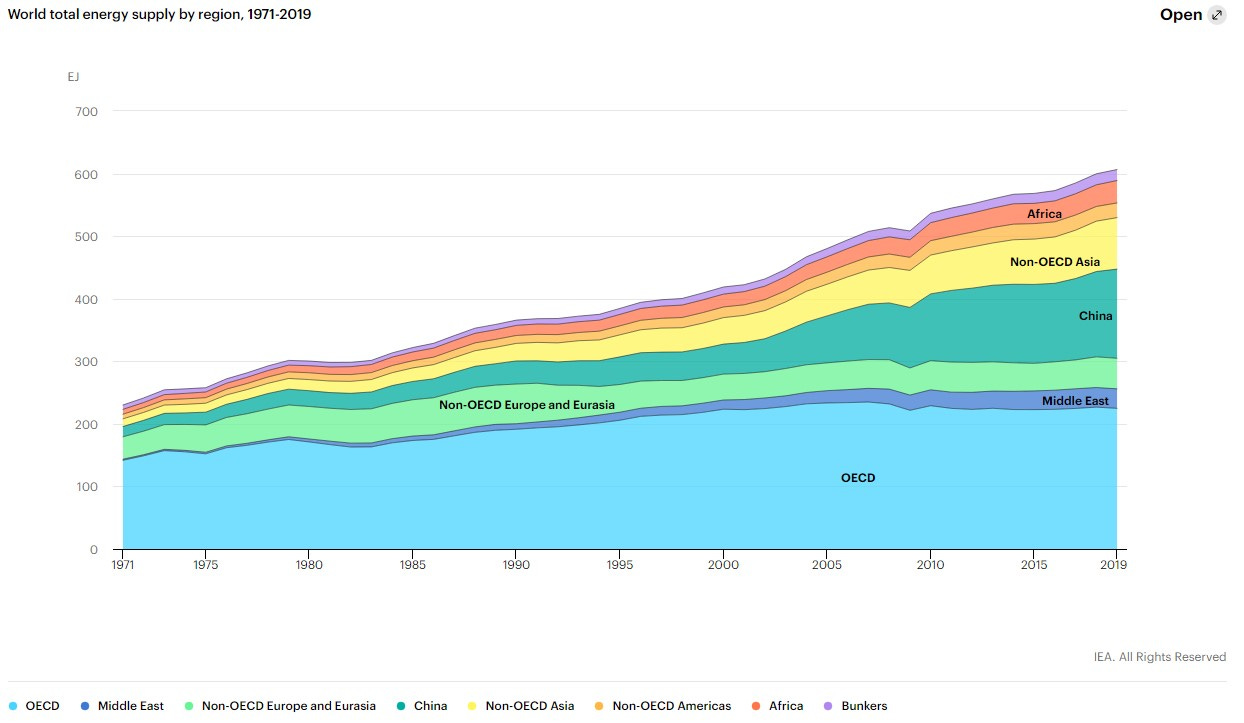
When we then turn to where the world’s population growth is going to come from, the challenge becomes stunningly clear: the world runs on hydrocarbons and will continue to rely on hydrocarbons in a very significant way.
Figure 20, World Population Forecast 2100 By Continent

Global population growth in areas with an energy mix that favors traditional hydrocarbons comes at a time where E&P companies have laid out clear return-to-shareholder plans with some of them returning 80% of FCF to stockholders. Additionally, in an effort to produce in a more sustainable way, ESG metrics have become part of executives’ compensation plans. In order to get a better sense for how companies are shifting their strategies, I recommend Pioneer Natural Resource’s Q4, 2021 investor presentation.
To reconcile spare capacity or the lack thereof with individual company plans, understanding the oil base production decline is important (how much would production fall without any investment.)
In our analysis, the total U.S. oil base production decline is 34%, which would result in a 4.2 MMbb/d reduction after one year in the absence of additional drilling.17
Kyle Bass, who has pointed to the issue of underinvestment in E&P long before crude exceeded $100, talked about Crude Oil’s decline curve and demand growth over the coming decade+ (very different from the world’s ambitions per Net-Zero etc.).18
I think in the long run, owning hydrocarbon production, owning royalties is going to be a very lucrative business. I think that we’re going to see hydrocarbon growth until 2035-2040. The decline curve itself has about a 6 % or 7% decline annually. The world needs to replace 6 or 7 million bbl/day each year just to tread water. This war has exacerbated the structural deficiencies that we have.
How significant the support for traditional fuels will be remains anybody’s guess. What appears to be necessary, though, is a transition in mindset from exclusion to inclusion — nat. gas, in particular, serves a tremendously important purpose if we want to reduce emissions.
Carbon Markets
In an introductory note to carbon markets - a topic I will further develop in a future writing, - I would like to point you to two resources.
Carbon Pricing Dashboard - The World Bank
Rising EU ETS emissions point to urgent need for a dynamic pricing paradigm - Carbon Pulse (Piere Andurand and Mark Lewis)
The idea behind a carbon market is to price the cost of negative externalities - emissions, - high enough in order to make their consumption economically unattractive. Without sufficiently pricing emissions in order to compensate cleaner sources of power for their positive externalities, the transition to cleaner energy production will be very difficult.
What To Think After This Recent Run Energies?
First, all these thoughts are subject to change without notice. This is a way to communicate different angles and why the oil & gas industry may be headed higher and for what reasons. If those indicators, for a lack of a better term, turn the other way, my views will invariably change as well.
The oil majors have had significant runs and it is important to note that price matters. The outlook remains favorable.
The global energy crisis makes one thing clear: abandoning hydrocarbons is extremely difficult and potentially dangerous. Seeing oil & gas producers as part of the solution would not only ease price pressures but also increase the velocity with which we can decrease emissions in the coming decades.
Should there be a substantial change in how the world views hydrocarbons as part of the solution, a re-rating of multiples may be warranted (an extension of lifetime asset value, etc.)
I still view this sector via a reflexivity lens where more sustained demand for longer will ultimately surprise and therefore lead to favorable conditions.
The re-rating comes after fears around stranded assets and an industry that may be done for good (this is a double whammy of improving industry fundamentals against all odds and healthier balance sheets.)
The potential for a 360 degree turn by policy makers cannot be ruled out. Using geopolitical concerns as a pretext for increasing fossil fuel production may lead to a sentiment shift.
Should policy shift in favor of E&P, higher cost projects such as offshore would benefit deep-water drillers like Transocean (still a highly levered balance sheet; the opportunity for a turnaround story is yet to be had, though.) — to be talked about more in a future article.
The Natural Gas industry, in particular, has contributed in a major way when it comes to a reduction in emissions (from coal —> nat. gas). From an emissions as well as a geostrategic standpoint, the U.S.’s LNG industry will play a fundamental role in the transition to renewables.
Russia signed a $400 bn gas supply deal with China in 2014 after the annexation of Crimea. What’s of particular interest to the gas markets this time is that one project under discussion - the Power of Siberia 2 - may take western Siberian gas supply away from Europe.
If China imports 104 billion cubic meters of gas via Russian pipelines, Russia may become the largest gas supplier to China, further strengthening geopolitical links between the countries. Gas prices for Power of Siberia are significantly lower than other import sources, averaging around $3.9 per million BTU in 2021, compared to $10.9 million for LNG imports during the same time, based on BNEF analysis of China customs data. - BNEF
In order to further support the importance of LNG in the process to renewables, I included a whole gambit of highlights from an Atlantic Council discussion called Net-Zero and The Future of Natural Gas below.
I also added the assessment of a variety of industry executives from the recent CERAWeek conference below.
Net-Zero and The Future of Natural Gas | Atlantic Council
Scott Strazik, Chief Executive Officer, GE Gas Power
As much as it’s very clear that renewables are going to drive most of the new capacity additions in the power sector, there is going to be a critical role for gas to play in this transition. We are talking about a decade of action. Coal to gas switching is going to play a material part. Gas’ existing install base compared to coal is half the emissions. Our carbon emissions in the U.S., emissions have come down by ~1/3, primarily with coal and gas switching. Because of shale gas, it is going to become much more available to the rest of the world as LNG supply grows. 19
Things like power density are so critical to deliver the electricity that’s needed. Realizing that different places have different resource capability.
Every $200bn that we are spending is increasing renewables penetration by 1%/year. Coal to gas is exponentially more capital efficient (in a post-pandemic world where capital efficiency is critical.) There is a lot we can do now.
Majid Jafar, Chief Executive Officer, Crescent Petroleum
We got 80% of the world’s coal consumption in Asia. China is 50% of the world’s coal, another 15% in India. Gas will play a key role as an enabler of renewables, it’s a necessary complement. The UAE energy policy for 2050 has exactly that balance between 40% of nat. gas and 40% of renewables. It is gas replacing coal that’s had a 100x bigger impact on reducing CO2 emissions in the last 10 years than all the other EVs in the world. Wood MacKenzie has estimated we need $2 trillion investment between now and 2040. The concern is that those sources for financing and investment are starting to dry up. Somehow, we have been put in this bucket as not part of the solution.20
For most of the developing world: health, education, poverty are an issue. Energy access is #8 before climate change. We still have 1 billion people without electricity, 3 billion with no clean cooking. The developing world is where the growth is. We are still focused on Asia now, Africa is coming. There is no point spending a trillion Euros in Europe when the demand growth is in Asia. It is like re-arranging the furniture in the bedroom when the living room is on fire.
Our region has 40% of the world’s proven nat. gas reserves, most of that was discovered looking for oil. It’s only really in the last 5-10 years that gas has become a target for exploration and development in the region in a major way (power demand, industry demand…). What we need is the right regulation to encourage investment (including private sector investment.) — as well as clear and transparent investment upstream. Worldwide, the 3 things that gas needs to get a push: be honest that 100% renewables won’t work — the message needs to be clear for the development banks and some of the private banks, who are turning the back on fossil fuels. When they refuse to invest in gas in developing countries, you will burn more coal. A carbon price would help to bridge that gap — in many of these developing countries coal will continue to be more competitive in developing countries. Trade wars are not helpful.
Charif Souki, Executive Chariman of the Board, Tellurian
I think it is a big mistake to underestimate the appetite of the developing world for energy consumption.
It is always the consumer that pays for it, one way or another. If it happens to be the consumer in India or China, it is going to be catastrophic.
On Hydrogen (the issue with getting rid of the Carbon from CH4)
The issue is going to be what you are going to do with the carbon. The infrastructure you would have to build to get rid of the carbon is prohibitavely expensive
Shakih Nawaf Saud Al Sabah, Chief Executive Officer, Kuwait Foreign Petroleum Exploration Company (KUFPEC)
The gas demand will continue to grow, but it still will not oil demand completely. Oil remains the transportation fuel. There is still a lot of demand that is not combusted (petrochemical products, etc.) In any scenario oil demand will continue to increase at least in the next 10-20 years.
Oil & Gas Executives at CERAWeek
Luckily, this writing coincides with CERAWeek by IHS Markit, one of the world’s leading energy conferences. CEOs and business operators in the oil & gas sector shared a wealth of information; therefore, I decided to include some of the interview highlights we got from operators in the space.
Freeport LNG CEO | LNG Terminals and Europe’s Energy Dependence on Russia via Bloomberg (03-08-2022)
We need to build many more LNG facilities and the best place to do that is the United States. The U.S. provides a very stable, consistent price. They are paying $15, $17, $18 (Europe). You get it to Europe for $9 (from the U.S.).
On Capacity
An LNG terminal takes between 4-5 years to build. There is adequate pipeline supply currently, but as we develop more natural gas, more pipelines will have to be build. FERC has made it very very difficult for many pipelines to get through. Hopefully this will change the narrative, natural gas is very important for Europe’s security, but also for the transition to clean fuels.
On U.S. LNG Exports and EVs
Right now the U.S. exports 12bcf of gas. If all of that gas goes to displace dirty coal in electric generation, we would have the carbon savings of the equivalent of 30 million EVs. The Biden admin hopes that we can get 15 million EVs by 2030, we are already doing that. We need to double the size of the LNG and export 25bcfs and have the equivalent of 60 million cars.
Europe vs. Asia Natural Gas Demand
They’re only going to be able to do it one way, and nobody’s going to like the answer. They have to burn coal. There just isn’t enough LNG in the world. Every LNG facility has been running flat out since the fall of 2020 when prices recovered after the pandemic. There is some more incremental LNG coming only from some new trains that just completed, one in the U.S. . Other than that, we got a finite amount. Hopefully the coal will be a temporary situation. Over the next few years, there’ll be more LNG terminals that can supplement what they’ve been losing from Russia. Remember, Asia had a mild winter this year. Asia allowed gas to go to Europe. Last year, 25-30% of my gas went to Europe; in Jan. and Feb. , 70% of gas from Freeport went to Europe. I don’t think that would have happened if it was cold in Asia. LNG exports to Europe were accelerating when Asia was well stocked and it didn’t get cold. What happens when both need it at the same time. Asia ends up with it, because Asia doesn’t have an alternative. For the short term, I think the only choice is burning coal just to get through next winter.
Scott Sheffield, CEO, Pioneer Natural Resources on CNBC
99% of drilling is on private lands. That’s where all the activity is (it’s not about federal leases and permits).
Pioneer is growing 5%/year. The Permian is still growing from 5 million bbl/day to 8 million bbl/day over the next 8-9years. We have a contract with our shareholders to pay back 80% of the FCF to the investor. We have to get shareholder support, we want the Biden admin to come out and support our industry, and we want people to ban oil & gas around the world.
Shareholders view on the industry with concerned shareholders: Banks aren’t loaning, there is no private equity in our industry. He needs to go to Saudi Arabia and the UAE (Biden) for the potential loss of 3-4 million bbl/day from Russia.
We also have shortages of frack sand, we have labor shortages, fleets, frack fleets. The labor force has gone through 3 downturns over the last 12 years. It takes a good 8-12 months to get things back together.
Ryan Lance, CEO, Conoco Phillips on CNBC
If you take another 1-2 million bbl off the market, that’s going to send prices higher (that’s how thinly balanced the system is today.)
We need to be thinking about the medium and long-term impact (Saudi Arabia can’t increase supply over the short term.)
Releases out of the SPR will help the short-term, but they don’t answer the longer term question.
We have leases, they take a long time to develop, we will drill on there when we understand the geologic work (you need a pipeline lease to drill over the long haul.) The industry will grow 800-900k bbl/day this year. If prices persist
John Hess, CEO, Hess on CNBC (03-08-2022)
Wall Street and gov. officials need to release that oil & gas are gonna be needed for the decades to come. The key challenge is investment. We are not investing enough. A reasonable estimate for that investment is $450bn/year of investment that needs to go into oil & gas to keep global supply meeting demand (the last 5 years we’ve been under that number.)
Our own budget is up 30% to $2.6bn (our production is going to grow 30%.)
The key is it is a matter of shareholder and stakeholder capitalism. When you run a business, you have to make high returns for your shareholders. Not enough people were focused on energy and economic.
Charif Souki, Executive Chairman, Tellurian on CNBC (03-08-2022)
The earliest possible where we can start making a dent is in 2 years when Golden Pass finishes if everything goes really fast. In 4 years, again, if we put all stops out, we can start delivering potentially 120million tons. Europe has made a conscious decisions to rely more on Russian gas and renewables. Bad combination.
On LNG Import Facilities in Europe
They can do an onshore plant in about 3 years. They can do a regasification facility on a ship in about 18 months. But the liquification is not gonna keep up with this. They might as well go for the onshore facility in 3 years and in 4 years we will be able to deliver gas.
Alan Armstrong, CEO, Williams Companies on CNBC (03-08-2022)
Infrastructure is the key. We have had 6 major pipelines that have been stopped/cancelled, projects that were certified by the Federal Energy Regulatory Commission (FERC). We have 31 projects that are in the queue. We have the capabilities, we have decades of low-cost gas supplies, but we have got big a big issue on getting our infrastructure permitted.
Natural gas is really where we really have the challenge on infrastructure and getting that built. It is just a matter of getting a supportive regulatory environment for getting these pipelines permitted (natural gas).
Today, it takes about 4 years to get a pipeline project approved (takes 6-9 months to build; 4-5x time for paperwork.)
We are just asking for clear, certain rules that we can abide by and move on. Basically all the agencies out of their swim lanes, nobody has clear responsibilities. We have got to clear up our permitting processes.
The Keystone XL (that was designed to bring oil from Canada to the Gulf of Mexico)
The Keystone XL makes a ton of sense to be connected to our Canadian partners.
Vicki Hollub, CEO, Occidental Petroleum on Bloomberg (03-08-2022)
For those that haven’t planned for it, the supply chain for the oil & gas industry is going to cause issues for anybody that thinks about ramping up now.
Our shale producers have been able to ramp up pretty quickly in the past; the Basin has the ability to do it, we have the ability and competency. We do want supply-demand to get back in balance.
Shortages in the tubing we run, pipeline products, trucking, sand, people — every industry
On OPEC
They don’t have the ability to match the lack of supply in a reasonable fashion.
Mohammad Barkindo, Outgoing General Secretary of OPEC on Bloomberg (03-08-2022)
The shale revolution was very timely to save the world from an imminent, global energy crisis.
In the current circumstances, the issue of investment has to be raised to the highest level of our priority.
We had decided last year in July that it was time for us to bring back 5.8 million bbl/day (as the last crunch of the 9.7m bbl/day that we withdrew in April 2020.) We are continuing to bring back 400k bbl/day. It is also noteworthy that not all our member countries are able to fulfill their monthly obligations because of capacity constraints. Again, we go back to underinvestment. Underinvestment is a global challenge that requires a global solution. We will continue to meet to do do whatever we can, to contribute our own quota in mitigating this catastrophe that is facing the global energy industry.
Physically, there is no shortage of oil at the moment.
Keep in mind, that none of this is financial advice and views are subject to change. Andermatt looks forward to the next research piece, which will be announced in the coming days.
As this forms the base for what will be a much more comprehensive view of the global energy markets (macro and micro level), we will complement future posts with the work done in this writing. Similar frameworks will also apply to other commodities — updates to be made.
I look forward to hearing from you and extending this discussion to a podcast format as well. If any of you can make an introduction to someone you think has something interesting to share with regards to the energy markets, I would love to have a conversation!
Until next time,
Andermatt Research
“U.S. Energy Information Administration - EIA - Independent Statistics and Analysis.” Energy & Financial Markets - Crudeoil - U.S. Energy Information Administration (EIA), https://www.eia.gov/finance/markets/crudeoil/supply-opec.php#:~:text=EIA%20defines%20spare%20capacity%20as,had%20the%20greatest%20spare%20capacity.
Curtis Winkle Curtis Winkle serves as Kimray's Content Writer. He works with Kimray product managers, et al. “A Short History of Oil: 1700-1870.” Kimray, https://kimray.com/training/short-history-oil-1700-1870.
Historical Oil Shocks* - University of California, San Diego. https://econweb.ucsd.edu/~jhamilto/oil_history.pdf.
“Standard Oil.” Encyclopædia Britannica, Encyclopædia Britannica, Inc., https://www.britannica.com/topic/Standard-Oil.
Desjardins, Jeff. “Chart: The Evolution of Standard Oil.” Visual Capitalist, 17 June 2020, https://www.visualcapitalist.com/chart-evolution-standard-oil/.
Priest, George L. “RETHINKING THE ECONOMIC BASIS OF THE STANDARD OIL REFINING MONOPOLY: DOMINANCE AGAINST COMPETING CARTELS.” Columbia Law, https://web.law.columbia.edu/sites/default/files/microsites/law-economics-studies/Priest,%20G%20-%202012%20Fall%20WS.pdf.
“The Ghost of John D. Rockefeller: Thomas J. DiLorenzo.” The Independent Institute, https://www.independent.org/publications/article.asp?id=164#:~:text=The%20efficiencies%20of%20economies%20of,to%200.29%20cents%20per%20gallon.
“Standard Oil Co. of New Jersey v. United States (1911).” Legal Information Institute, Legal Information Institute, https://www.law.cornell.edu/wex/standard_oil_co._of_new_jersey_v._united_states_(1911)#:~:text=Primary%20tabs-,Standard%20Oil%20Co.,the%20company%20be%20geographically%20split.
Brew, Gregory. “OPEC, International Oil, and the United States.” Oxford Research Encyclopedia of American History, 23 May 2019, https://oxfordre.com/americanhistory/americanhistory/view/10.1093/acrefore/9780199329175.001.0001/acrefore-9780199329175-e-719#acrefore-9780199329175-e-719-note-2.
Ibid.
Ibid.
“A Brief History of Fracking.” NES Fircroft, https://www.nesfircroft.com/blog/2019/07/a-brief-history-of-fracking.
“Timeline: Oil Dependence and U.S. Foreign Policy.” Council on Foreign Relations, Council on Foreign Relations, https://www.cfr.org/timeline/oil-dependence-and-us-foreign-policy.
Singhi, Arvind, and Ismail Alani. “Saudi Arabia Budget Report 2022.” KPMG, KPMG, 16 Dec. 2021, https://home.kpmg/sa/en/home/insights/2021/12/saudi-arabia-budget-report-2022.html.
“Shale Industry Write-Downs May Top $300BN: Deloitte: Argus Media.” Commodity & Energy Price Benchmarks, 22 June 2020, https://www.argusmedia.com/pt/news/2116691-shale-industry-writedowns-may-top-300bn-deloitte.
Yergin, Daniel. “Why the Energy Transition Will Be so Complicated.” The Atlantic, Atlantic Media Company, 8 Dec. 2021, https://www.theatlantic.com/international/archive/2021/11/energy-shock-transition/620813/.
Steve Hendrickson, Ralph E. Davis Associates. “Why Us Shale Production Declines Are Higher than You Might Think.” Hart Energy, https://www.hartenergy.com/exclusives/why-us-shale-production-declines-are-higher-you-might-think-188251#:~:text=Total%20U.S.%20Oil%20Production%20Decline,the%20absence%20of%20additional%20drilling.
“If We're Going to Sanction, We Must Secondarily Sanction Bad Actors, Says Kyle Bass.” CNBC, CNBC, 8 Mar. 2022, https://www.cnbc.com/video/2022/03/08/we-must-be-willing-to-secondarily-sanction-bad-actors-says-kyle-bass.html.
“Future of Energy: GE Gas Power.” Gepower-v2, https://www.ge.com/gas-power/future-of-energy.
Jaganathan, Jessica. “Rising Gas Demand through 2040 Needs $2 Trillion in Capital - Woodmac.” Reuters, Thomson Reuters, 11 Nov. 2020, https://www.reuters.com/article/uk-global-lng-woodmac/rising-gas-demand-through-2040-needs-2-trillion-in-capital-woodmac-idUSKBN27R30P.